


.png)


Phishing is still the single most reliable way attackers get inside an organization. The Anti-Phishing Working Group tracked roughly 3.8 million phishing attacks across 2025, slightly above the 3.76 million it logged in 2024. The Verizon 2025 Data Breach Investigations Report found that the median user clicks a phishing link just 21 seconds after receiving it, while it takes 28 minutes for the median user to report one. And the IBM 2025 Cost of a Data Breach Report puts the average cost of a phishing-initiated breach at $4.8 million, with 254 days to detect and contain. The story for 2026 is not that phishing is new. It is that the volume is steady, the dollar cost is rising, and AI has made convincing lures cheaper to produce than ever.
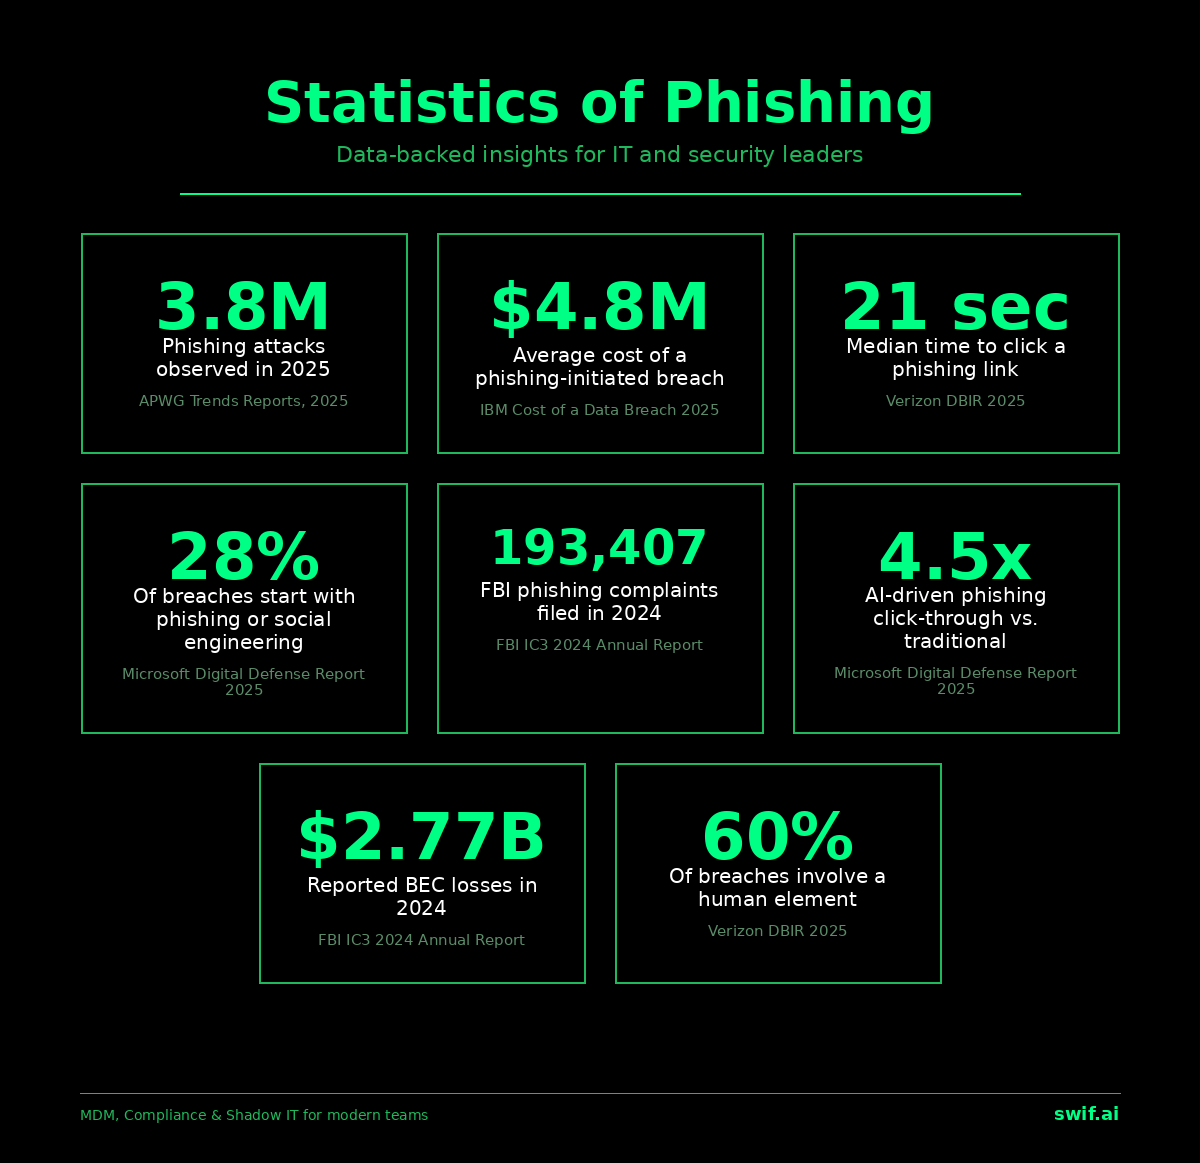
Phishing statistics at a glance
- 3.8 million phishing attacks were observed across 2025, roughly 1% higher than 2024 (APWG Phishing Activity Trends Reports).
- 16% of all data breaches began with phishing in the 2025 reporting period; phishing remains the most common single initial-access vector overall (Verizon 2025 DBIR).
- $4.8 million is the average cost of a phishing-initiated breach in 2025, and it takes 254 days on average to detect and contain (IBM Cost of a Data Breach 2025).
- 21 seconds is the median time it takes a user to click a phishing link after receiving it (Verizon 2025 DBIR).
- 28% of breaches tracked by Microsoft start with phishing or social engineering (Microsoft Digital Defense Report 2025).
- AI-driven phishing is 3 to 4.5x more effective than traditional phishing campaigns, with click-through rates rising from 12% to 54% in observed tests (Microsoft Digital Defense Report 2025).
- 193,407 phishing or spoofing complaints were filed with the FBI in 2024, more than double the next most-reported cybercrime category (FBI 2024 IC3 Annual Report).
- $2.77 billion in business email compromise losses were reported to the FBI in 2024 across 21,442 complaints (FBI 2024 IC3 Annual Report).
- 60% of confirmed breaches involved a human action such as clicking, replying, or misdelivery (Verizon 2025 DBIR).
4.93% average failure rate on simulated phishing tests across organizations using mature awareness training (Proofpoint State of the Phish).
Phishing volume and reach in 2025 to 2026
Phishing volume has been remarkably stable at the macro level. The Anti-Phishing Working Group logged 3,759,576 phishing attacks in 2024 across its four quarterly reports, and 3.8 million across 2025 (1,003,924 in Q1, 1,130,393 in Q2, 892,494 in Q3, and 853,244 in Q4). The slight quarter-on-quarter decline through the back half of 2025 disguised a sharp shift in attack vectors. APWG observed scams flooding social media, SMS, and QR codes faster than email phishing was rising, so the email count moved sideways while overall social engineering pressure grew.
Microsoft, which sees a different slice of traffic through Defender for Office 365, flags an even larger absolute volume. Its 2025 Digital Defense Report counted 8.3 billion phishing threats over the reporting period, and the company's email threat landscape data showed QR code phishing volumes jumping from 7.6 million in January 2026 to 18.7 million in March 2026, with QR codes embedded directly in email bodies up 336% in March alone.
Per-user exposure rates also stayed high. The Proofpoint State of the Phish research found that 99% of organizations were regularly targeted for account takeovers, and nearly 62% were impacted by at least one successful takeover. The same dataset put the average user failure rate on simulated phishing at 4.93%, with the energy and utilities sector lowest at 3.6% and the legal sector highest at 8.9%.
Phishing as the cause of data breaches
Phishing's status as the most common initial-access vector is what makes it the single most-cited statistic in this space. The Verizon 2025 DBIR attributes 16% of confirmed data breaches to phishing as the initial vector, narrowly behind credential abuse at 22% and ahead of vulnerability exploitation at 20%. Phishing also appears in 15% of all breaches when measured across the full incident sample, and in 19% of breaches inside the EMEA region.
Microsoft's telemetry is higher, with the Digital Defense Report 2025 attributing 28% of breaches to phishing or social engineering as the entry point, 18% to unpatched web assets, and 12% to exposed remote services. The ENISA Threat Landscape goes further still, finding that phishing accounted for 60% of observed initial-intrusion cases in its 2025 reporting window (July 2024 to June 2025) across European critical sectors.
Across all three reports, the through-line is identical. Even when vulnerability exploitation or credential stuffing tops the chart in a given year, phishing is the supply chain feeding those numbers. The Verizon 2025 DBIR noted that 60% of confirmed breaches involved a human element of some kind, with phishing being the most common form of that human element.
The cost of a phishing attack
The IBM 2025 Cost of a Data Breach Report puts the global average cost of a data breach at $4.44 million, and the average cost of a phishing-initiated breach specifically at $4.8 million. Phishing breaches take 254 days on average to identify and contain. For comparison, breaches that originated with stolen or compromised credentials still take longer on average, but phishing has the highest concentration of incidents with full lateral movement before detection.
Direct fraud losses from phishing are easier to count. The FBI 2024 IC3 Annual Report logged 193,407 phishing or spoofing complaints, more than double the next-most-reported category (extortion). Reported direct losses from those phishing complaints totaled over $70 million, but that number understates the real picture badly. Phishing is the typical entry vector for business email compromise (BEC), which generated $2.77 billion in reported losses across 21,442 complaints in 2024. BEC has cost US victims roughly $17.1 billion since the IC3 began tracking it in 2015, a 1,025% rise in annual losses over the decade.
Aggregate cybercrime damage that traces back to phishing as an enabler is enormous. The FBI IC3 reported total cybercrime losses of $16.6 billion in 2024, a 33% increase year over year, with phishing and BEC being two of the three largest contributors.
Industries most targeted by phishing
Phishing volume is not evenly distributed. The APWG consistently finds the financial sector at the top of attacked industries by share of phishing campaigns, followed by social media, webmail, and software-as-a-service. Across 2024 and 2025, financial institutions accounted for roughly a quarter of all phishing attempts in any given quarter.
Click-rate vulnerability tells a different story by sector. The Proofpoint State of the Phish simulation dataset places legal services at the highest failure rate at 8.9%, with retail, hospitality, and healthcare clustered above the all-industry average. Energy and utility employees were the most resistant at a 3.6% failure rate, likely because their compliance regimes mandate frequent training cycles.
The IBM 2025 Cost of a Data Breach Report continues to put healthcare at the top of the per-breach cost ranking. Healthcare breaches now average $7.42 million per incident, well above the $4.44 million all-industry average. Financial services and pharmaceuticals follow.
Click rates and the human factor
Two numbers from the Verizon 2025 DBIR define the modern phishing problem. The median time from phishing email delivery to click is 21 seconds. The median time from delivery to a user reporting the email to security is 28 minutes. Attackers have a roughly 27-and-a-half-minute head start over defenders the moment the first user falls for a campaign.
Ongoing security training compresses that gap but does not close it. The Verizon 2025 DBIR found that employees who completed recent training report simulated phishing at a 21% rate, a four-fold increase over the 5% base rate for untrained employees. The median click rate on phishing simulations across organizations stays at roughly 1.5%, with peaks above 8% in less-trained user populations.
Notably, the Proofpoint State of the Phish data shows that reporting culture varies dramatically by sector. Financial services reports simulated phishing messages at an average rate of 32.35%, the highest of any vertical, while education trails at 7.71%. Reporting behavior, more than click rates, is what gives security teams a chance to interrupt an in-progress campaign.
Emerging phishing trends in 2026
AI has fundamentally changed the unit economics of phishing. The IBM 2025 Cost of a Data Breach Report observes that generative AI has cut the time required to write a convincing phishing email from roughly 16 hours of human effort down to about 5 minutes, eliminating most of the language and contextual errors that used to make phishing easy to spot. IBM also reports that 16% of breaches involved AI use by the attacker in 2025, with phishing (37%) and deepfake impersonation (35%) as the two most common AI-enabled tactics.
The effectiveness lift is large. The Microsoft Digital Defense Report 2025 found that AI-generated phishing campaigns achieved click-through rates of up to 54%, compared to 12% for traditional ones, making AI-enhanced campaigns 4.5 times more effective per send. Microsoft also estimates that AI can make some phishing operations up to 50 times more profitable by improving targeting at scale.
Non-email phishing channels are also surging. QR code phishing, often called quishing, increased by approximately 400% between 2023 and 2025 according to Microsoft data, and the APWG is tracking SMS phishing, voice phishing (vishing), and social media impersonation as distinct categories that grew faster than email phishing through 2025. APWG's year-in-review for 2025 concluded that scams have, in volume terms, moved out of the inbox and onto every other channel that touches a phone.
Defenses are evolving in step. The CISA Implementing Phishing-Resistant MFA fact sheet documents that phishing-resistant MFA (FIDO2 and PKI-based authentication) can prevent over 99% of identity-based attacks, even when the attacker has the correct username and password. Microsoft's 2025 reporting matches that number. Yet adoption is still uneven, especially in mid-market organizations, and MFA fatigue attacks appeared in 14% of incidents in the 2025 DBIR, making them the dominant MFA bypass method when an organization has only deployed push-based MFA rather than phishing-resistant tokens.
For broader context on the trends above, see our social engineering statistics and security awareness training statistics roundups.
How swif.ai helps reduce phishing risk
swif.ai gives IT and security teams a single console to enforce device, identity, and compliance controls across the macOS, Windows, and Linux endpoints behind the numbers above. Explore swif.ai mobile device management to see how it works.


.webp)


