


.png)


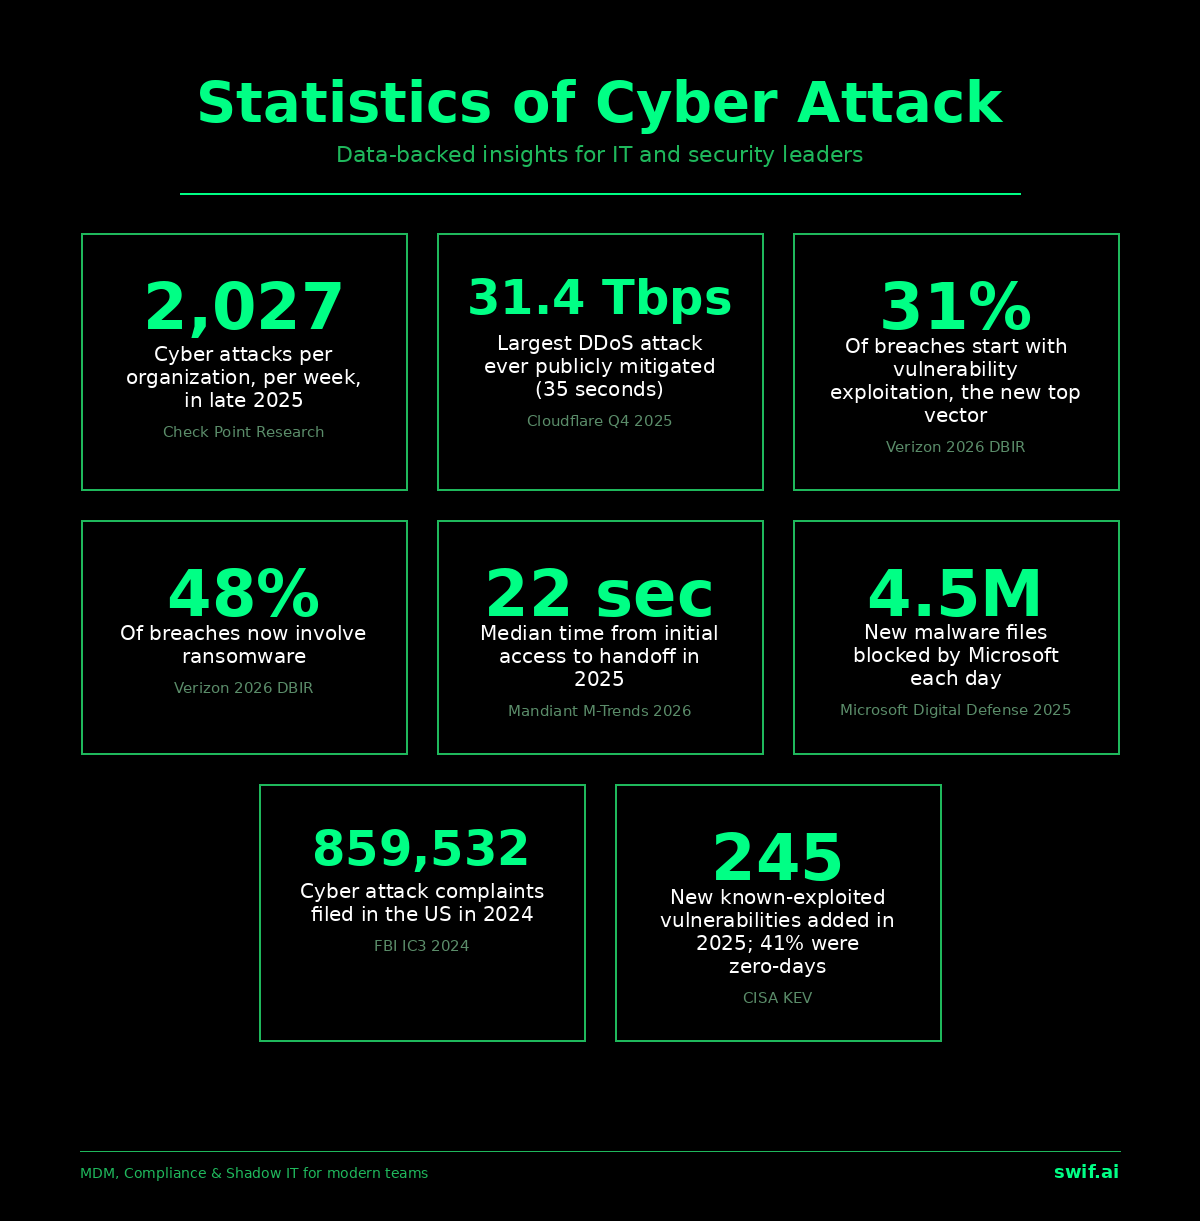
Cyber attacks are now a constant, automated background hum rather than an episodic event. Organizations are hit an average of 2,027 times per week, up 9 percent year over year, according to Check Point Research. The Verizon 2026 Data Breach Investigations Report found that vulnerability exploitation has overtaken stolen credentials as the leading way in, sitting behind 31 percent of breaches, while ransomware turned up in 48 percent. And once attackers do get in, Mandiant’s M-Trends 2026 report shows the median handoff between an initial-access broker and a follow-on operator has fallen from over eight hours in 2022 to just 22 seconds in 2025. The numbers below break down what attackers are doing right now and where defenders should focus this year.
Summary: key cyber attack statistics for 2026
- Organizations now face an average of 2,027 cyber attacks per week, a 9 percent rise over the previous year, per Check Point Research.
- Vulnerability exploitation is the top initial-access vector for the first time in 19 years of Verizon DBIR tracking, behind 31 percent of breaches.
- Ransomware is present in 48 percent of breaches studied in the 2026 DBIR, up from 44 percent the prior year.
- The largest publicly disclosed DDoS attack on record peaked at 31.4 Tbps over just 35 seconds, mitigated automatically by Cloudflare in Q4 2025.
- Median time from initial access to handoff fell to 22 seconds in 2025, according to Mandiant, down from over eight hours in 2022.
- Microsoft blocks roughly 4.5 million new malware files per day and analyzes 38 million identity-risk detections, per the Microsoft Digital Defense Report 2025.
- The FBI Internet Crime Complaint Center logged 859,532 cyber attack complaints in 2024, with nearly 4,900 attacks on US critical infrastructure.
- Public-facing application exploits drove 30 percent of intrusions traced by IBM X-Force, with valid-account abuse appearing in nearly one-third of cases.
- 245 new known-exploited vulnerabilities were added to the CISA KEV catalog in 2025, of which 41 percent were zero-days.
Global median dwell time rose to 14 days in 2025 (from 11 in 2024), per Mandiant M-Trends 2026.
Attack volume and frequency
The headline number for 2026 is that defenders are operating against industrialized, always-on attack traffic. Check Point Research recorded a global average of 2,027 cyber attacks per organization per week in December 2025, up from 1,925 in Q1 and 1,984 in Q2. The annual increase came in at 9 percent year over year, and at the regional level Africa led with 3,286 attacks per week per org while Latin America saw the largest year-over-year jump at 108 percent.
Sector-level intensity is uneven. Education absorbed the heaviest load throughout the year, with 4,656 attacks per organization per week by late 2025, according to Check Point. Government followed at 2,678 weekly attacks and telecommunications at 2,664. The retail and consumer goods sector saw the steepest year-over-year acceleration.
The volume picture is reinforced by what individual vendors observe on their own networks. Microsoft processes more than 100 trillion security signals per day, blocks roughly 4.5 million net-new malware files, analyzes 38 million identity-risk detections, and screens 5 billion emails for phishing and malware. Microsoft also reported that more than 90 percent of the 15.9 billion account-creation attempts it saw in the first half of 2025 came from bots, illustrating how much of attack volume is now fully automated.
How attackers get in: initial access vectors
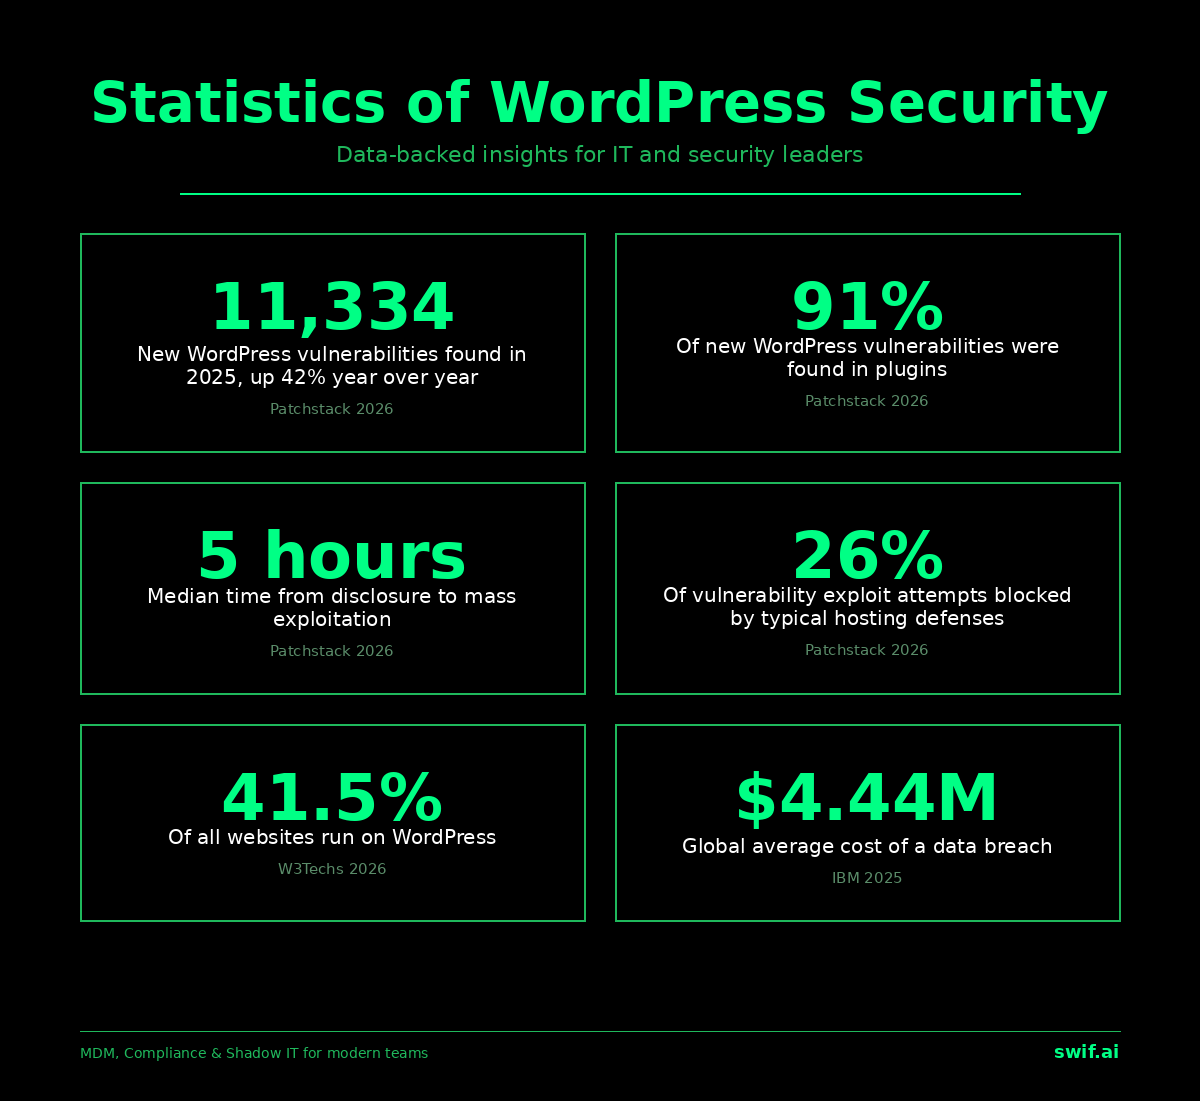
For the past two decades, stolen credentials sat at the top of the initial-access leaderboard. That changed in 2026. The Verizon 2026 DBIR reports that vulnerability exploitation is now the leading initial-access vector at 31 percent of breaches, compared with 13 percent for credential abuse. It is the first time in 19 years of the report that exploits have surpassed stolen credentials. Only 26 percent of vulnerabilities in the CISA Known Exploited Vulnerabilities catalog were fully remediated in 2025, and median remediation time stretched from 32 days to 43 days.
Zero-day exploitation is a meaningful share of that activity. CISA added 245 new entries to the KEV catalog in 2025, bringing the total to 1,484, and 41 percent of those new additions were zero-days at the time they were exploited. Mandiant corroborates the trend: exploits have been the leading entry vector in its incident-response engagements for six consecutive years, and voice phishing climbed to the second-most-common entry point in 2025, appearing in 11 percent of investigations with an identifiable vector.
The picture from IBM X-Force adds detail. In its 2025 Threat Intelligence Index, exploitation of public-facing applications was the top initial access vector, and nearly one-third of intrusions began with the use of valid account credentials, often purchased from infostealer marketplaces. IBM also tracked an 84 percent year-over-year increase in weekly infostealer distribution via phishing through 2024, with another 180 percent uptick in early 2025.
Ransomware as an attack pattern
Ransomware continues to dominate the attack chain, regardless of whether victims pay. The Verizon 2026 DBIR shows ransomware in 48 percent of breaches, up from 44 percent in the 2025 edition and 32 percent the year before. Sixty-nine percent of victims refused to pay in 2025, up from 64 percent the prior year, and the median ransom payment dropped to $139,975 from $150,000 in 2024.
The pipeline into ransomware now runs through infostealers. Half of ransomware victims with a prior credential leak experienced that leak within 95 days of the attack, according to Verizon, a strong signal that initial-access brokers are packaging stolen credentials and selling them to ransomware affiliates rather than sitting on them. Mandiant M-Trends 2026 documents the same compression at the handoff layer: the median time between initial access and the next attacker stepping in fell from more than eight hours in 2022 to 22 seconds in 2025, a level that only an automated pipeline can sustain.
US incident data tells a similar story. The FBI Internet Crime Complaint Center 2024 Internet Crime Report counted 3,156 ransomware complaints, up 9 percent year over year, and identified 67 new ransomware variants in 2024. Akira, LockBit, RansomHub, FOG, and PLAY were the most-reported families, with FOG, Lynx, Cicada 3301, Dragonforce, and Frag emerging fastest among the newcomers.
DDoS and network-layer attack activity
Network-layer attack volume hit a new ceiling in late 2025. Cloudflare mitigated a 31.4 Tbps DDoS attack in Q4 2025, the largest publicly disclosed attack on record. It lasted just 35 seconds and was handled automatically. Across the full year, DDoS attacks rose 121 percent, with Cloudflare blocking an average of 5,376 attacks per hour.
The fourth quarter alone saw hyper-volumetric attacks (defined as exceeding 1 Tbps or 1 billion packets per second) grow 40 percent over Q3. Most of those hyper-volumetric campaigns targeted telecommunications, service providers, and carriers, according to Cloudflare. The botnet behind much of the late-2025 activity, tracked as Aisuru-Kimwolf, ran sustained HTTP DDoS campaigns above 200 million requests per second during what Cloudflare nicknamed The Night Before Christmas attack.
Identity attacks and automated credential abuse
Identity remains the most actively targeted surface, even as exploit-based entry rises in raw share. Microsoft reported a 32 percent rise in identity-based attacks during the first half of 2025, with 97 percent of those attempts taking the form of password spray or brute force. Phishing-resistant MFA blocks roughly 99 percent of that traffic, but coverage is still uneven across enterprise environments.
The Verizon 2026 DBIR notes that credential abuse remains the second-leading initial-access vector at 13 percent of breaches, even after vulnerability exploitation overtook it. Pretexting (an attacker fabricating a scenario to manipulate a target) is now a common precursor to both ransomware and extortion, and voice and SMS phishing now outperform email-based phishing in success rate against users. Microsoft also confirmed that ransomware and extortion drove over half of all cyber attacks observed in its 2025 dataset.
US incident reporting and critical infrastructure
The FBI Internet Crime Complaint Center serves as the closest thing the US has to a national incident registry. In 2024, IC3 received 859,532 cyber attack complaints, down slightly from 880,418 in 2023. Reported losses from those incidents rose more than 33 percent year over year, indicating that even as complaint volume plateaued, attack severity went up.
Critical infrastructure is bearing a disproportionate share. The FBI logged 4,878 cyber attack reports from organizations classified as US critical infrastructure in 2024, with ransomware the dominant complaint type. Critical manufacturing absorbed the most ransomware incidents, while healthcare faced the most data breaches. Phishing was the single most common complaint category overall, accounting for more than 20 percent of all 2024 cyber crime reports.
Detection, dwell time, and the speed of response
How long an attacker stays inside before being caught is one of the clearest indicators of how a defender is performing. According to Mandiant M-Trends 2026, global median dwell time rose to 14 days in 2025, up from 11 days in 2024. The increase was driven mostly by a high volume of cyber-espionage investigations and North Korean IT-worker operations, where median dwell time hit 122 days, with some intrusions persisting undetected for more than a year.
There is good news in the detection mix. Just over half of organizations detected malicious activity internally in 2025, an improvement on the prior year, per Mandiant. When external entities (often law enforcement or a third party) notified the victim, median dwell time was 26 days; when the adversary itself disclosed (typically a ransomware note), it was just 5 days. Organizations that detected internally averaged 10 days, suggesting that mature detection is still the single most reliable way to shorten exposure.
Emerging trends and what is new in 2026
Several shifts in the data deserve special attention from IT and security leaders planning the rest of 2026.
First, attacker AI is now visible in incident data rather than projection. The Verizon 2026 DBIR notes that large language models and AI agents are helping adversaries write exploits, generate phishing lures, and scale documented techniques. The visible result is that the window between disclosure and exploitation of a vulnerability has compressed from months to hours.
Second, third-party and supply-chain pathways are growing. Verizon found that breaches involving a third party now account for 48 percent of all breaches, with third-party involvement up 60 percent year over year. That has direct compliance implications for any organization with a vendor footprint.
Third, the attack on identity infrastructure is becoming explicit. Mandiant observed groups including the operators behind Akira (REDBIKE) and Qilin (AGENDA) deliberately destroying recovery mechanisms: deleting cloud backup objects, abusing misconfigured Active Directory Certificate Services, and targeting hypervisors. The implication is that traditional backup-based recovery is no longer sufficient on its own.
Fourth, voice and SMS phishing have overtaken email phishing in success rate. The Verizon 2026 DBIR and Mandiant M-Trends 2026 both note that pretexting calls and smishing now produce a higher hit rate than traditional email lures, with vishing alone responsible for 11 percent of Mandiant investigations where the initial vector was known.
Fifth, enterprise zero-days remain the prized currency. Public reporting puts roughly 90 zero-days in the wild during 2025, with about 48 percent of tracked zero-day exploitation aimed at enterprise technologies, an all-time high in both raw count and share, per data flowing into the CISA KEV catalog.
For broader context on the trends above, see our ransomware statistics and phishing statistics roundups.
How swif.ai helps
swif.ai gives IT and security teams a single console to enforce device, identity, and compliance controls across the macOS, Windows, and Linux endpoints behind the numbers above. Explore unified endpoint management to see how it works.


.webp)


